| FRI > Biolab > Supplements > FragViz: Visualization of Fragmented Networks > Network details | |
Experimental analysisThe performance of the proposed algorithm was assessed on different
gene networks that all include
genes which were most differentially expressed in the leukemia gene
expression data set (Golub Based on the set of differentially expressed genes and different means to estimate the gene similarity, we have defined five distinct gene networks. Network N1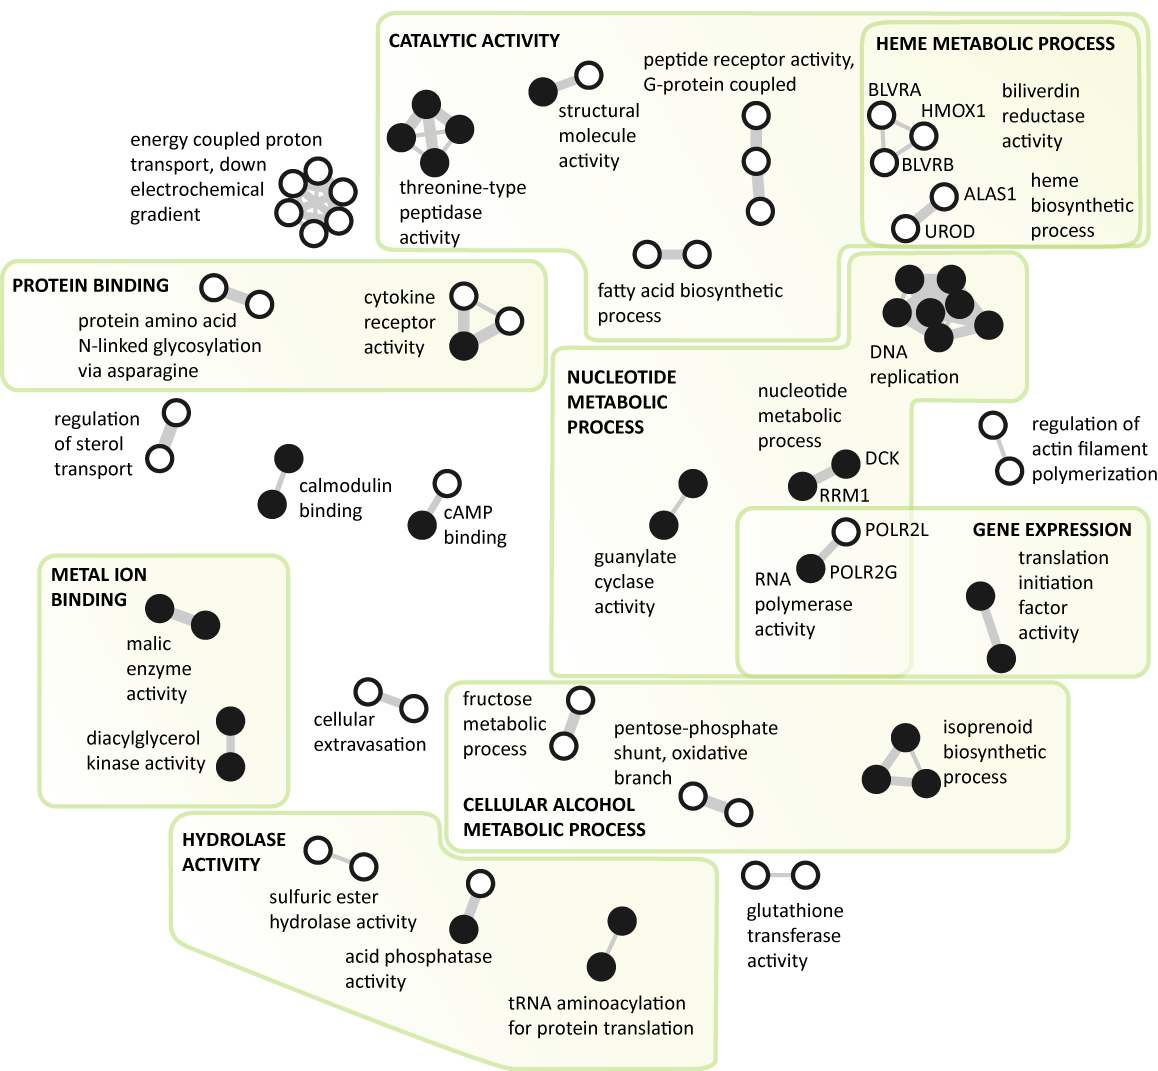 The similarity of the genes relates to their biological functions and was calculated based on their membership in canonical biological pathways using the Jaccard index. The information on the membership of genes in biological pathways was acquired from the Molecular Signature Database (Subramanian The "guanylate cyclase activity", "nucleotide metabolic process", "RNA polymerase activity", and "DNA replication" components in N1 all connect genes significantly over-expressed in acute lympoblastic leukemia. All of these genes have a function in nucleotide metabolism and DNA biosynthesis. It is well known that lymphoblastic cells typically have severalfold higher activity of enzymes responsible for nucleotide metabolism enabling excessive proliferation of transformed cells (Scholar and Calabresi, 1973). Moreover, some of the pathways active in nucleotide metabolism, for example de novo purine synthesis (DNPS), have been recognized as important targets of antileukemic agents (eg. methotrexate, mercaptopurine). In combination with other therapeutical agents, these drugs have improved survival of children with ALL to an overall cure rate of approximately 80 percent (Pui and Evans, 2006). The N1 network clearly demonstrates this characteristic of acute lymphoblastic leukemia. Data files: distance matrix (tutorial on this data), distance matrix data, network (tutorial on this data), network data Network N2.1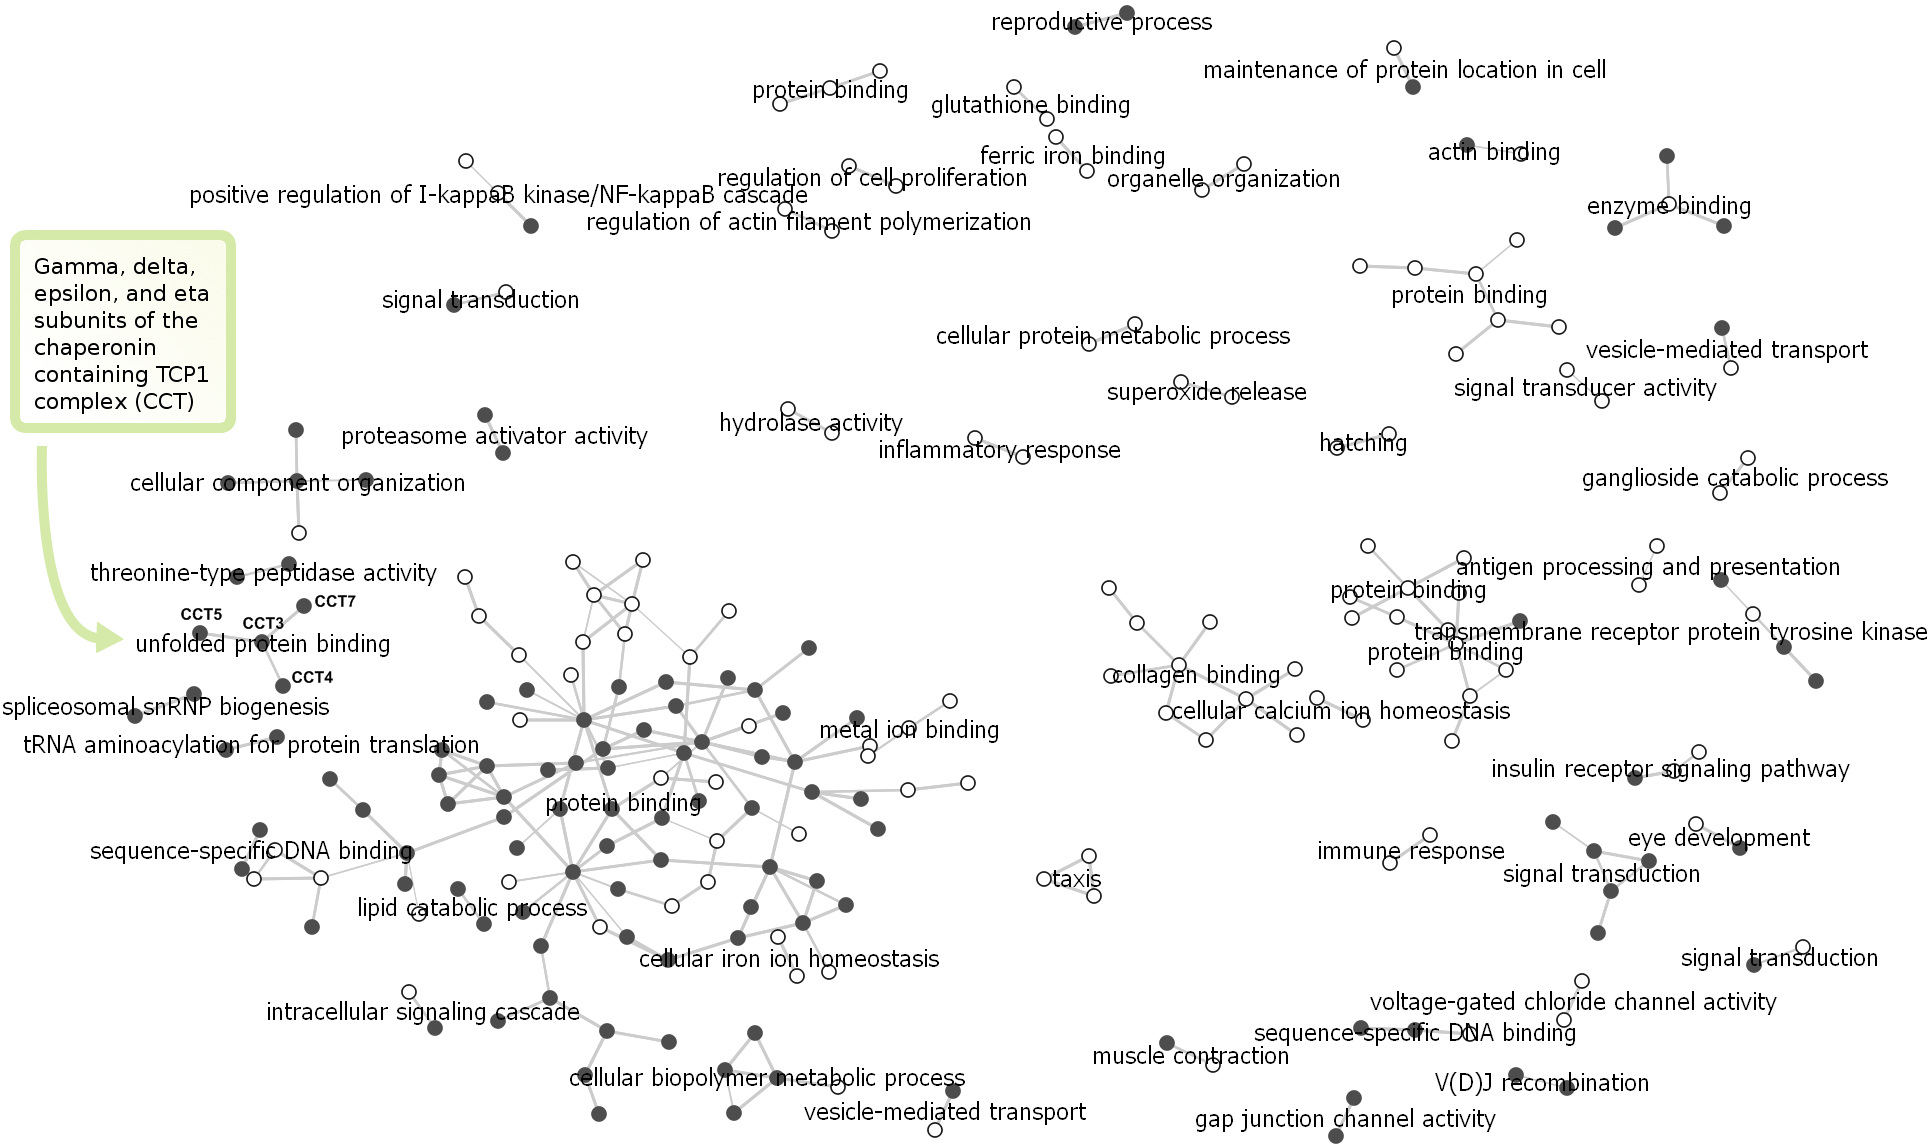 The similarity between genes as computed by Huttenhower As in network N1, most of the graph components connect genes that are over-expressed in one of the two investigated kinds of leukemia (all genes in the component are the same color), demonstrating the well known phenomenon that not only individual genes, but whole processes and pathways are disrupted in cancer cells (Hanahan and Weinberg, 2000). Data files: distance matrix, distance matrix data, network (a), network data (a) Network N2.2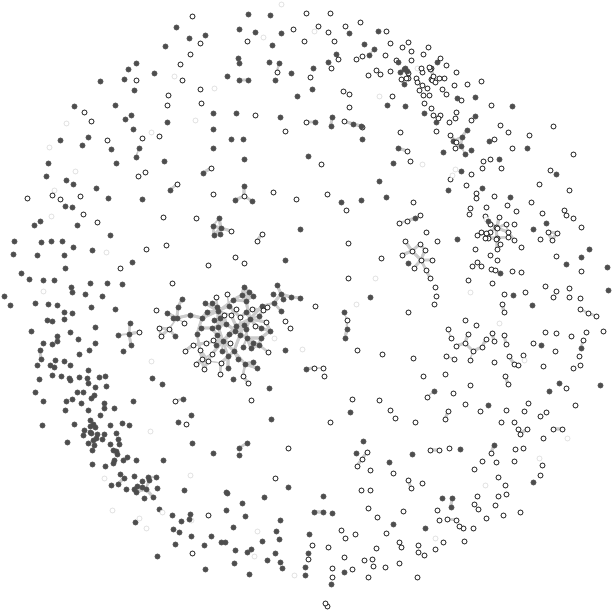 For this network the same similarity scores and threshold as in N2 were used (the Huttenhower One can observe that the genes significantly differentially expressed in the two investigated leukemias cluster together. The empty circles (AML) are clustered in the right part of the graph and the solid ones (ALL) in the left part, again demonstrating that expression changes in cancer tissues are disrupted on the level of pathways and processes. Data files: network (b), network data (b) Network N3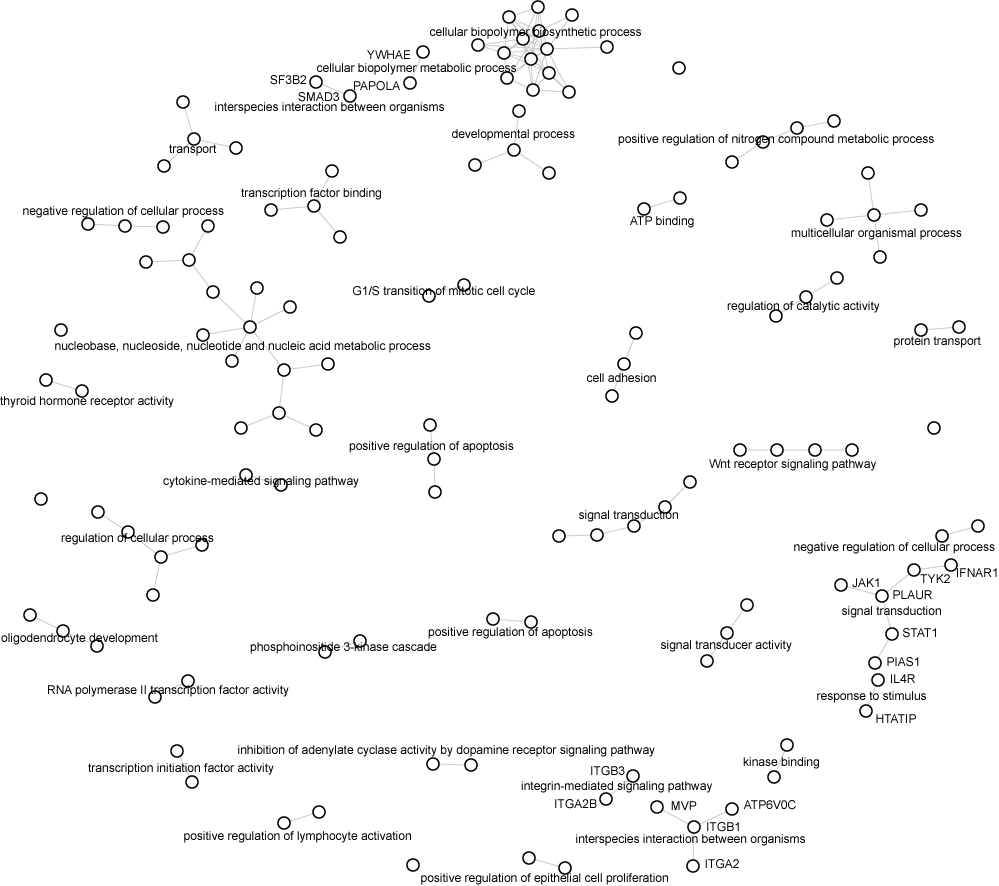 Protein-protein interaction network: theleukemia genes were connected into the network based on their protein interactions from the MIPS mammalian protein-protein interaction database [19]. In addition, we used the biological function similarity score (described under N1) for placing the interacting protein components based on the similar biological functions of the proteins comprising them. Several gene products (proteins) that lie close to each other in the FragViz* optimized network are actually in interaction based on a different public repository that stores protein-protein interactions identified by experimental results, the Human Protein Reference Database (HPRD) [25]. For example, the protein Integrin beta 3 (itgb3 ) is, based on the data in HPRD, in inter action with protein Integrin beta 1 (itgb1). Also, proteins Poly A polymerase alpha (papola) and SMAD3 are both in interaction with protein smad2. According to HPRD, protein interactions also exist among proteins in the components il4r-htatip and the near-lying component in the optimized layout. Data files: distance matrix, network, network data Network N4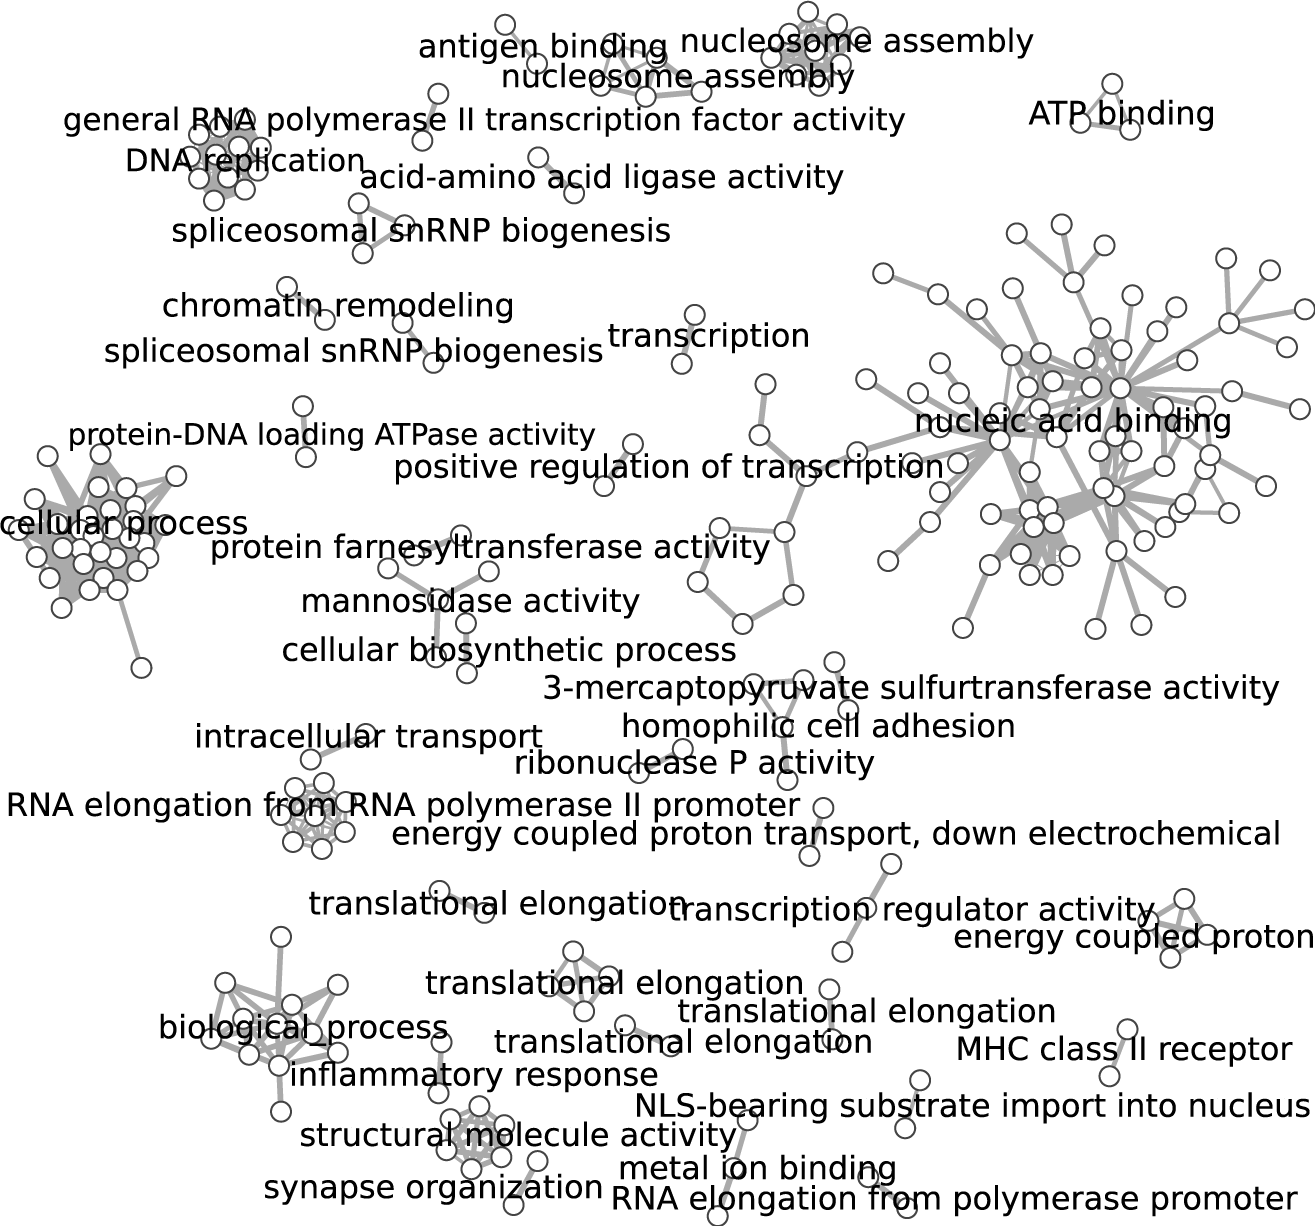 The gene similarities are calculated based on common reference in articles form the PubMed using the Jaccard index. Two genes are similar if they are referenced together in several PubMed articles. The similarity threshold was set to 0.5. Notice that the largest component consists mainly of genes associated with nucleic acid binding. Names of many other components in the network are associated with gene expression, DNA biosynthesis and protein translation. Network N4 illustrates that genes with such biological functions have been intensively investigated for their role in acute leukemias (Pui and Evans, 2006; Scholar and Calabresi, 1973; Garcia-Manero Data files: distance matrix, distance matrix data, network, network data |
|
 |
|