 |
|
Spotlight Try VizRank online - You can now experiment with VizRank
online. Find interesting data projections of your own data sets. |
| FRI > Biolab > Supplements > VizRank | ||||
Start with VizRank in OrangeHere we provide a short tutorial to Orange and its visual programming interface. In tutorial we present a schema which loads the data file and sends it to scatterplot and radviz visualizers, which can invoke VizRank to find interesting projections. For more details on Orange, see the Orange Widgets white paper. Orange Canvas and Visual ProgrammingVizRank is a tool that is implemented inside Orange, which can be downloaded here. Start Orange by invoking the application called Orange Canvas - the shortcut to it should be on your desktop and in your Start menu. Orange Canvas is an application that can be used to interactively explore, visualize and model the data using several components called widgets. The figure below is a screenshot of the application and a sample schema that can be used to find interesting data projections using scatterplot and radviz visualization methods.
Try creating such a schema yourself, or downloaded it here and load it in Orange Canvas by clicking File/Open menu. Loading a Data SetDouble-click on the File widget icon in the canvas. The widget opens a window. If this is the first time you use Orange, the interface should look like the screenshot below, else, the drop menu will include the names of the recently loaded files.
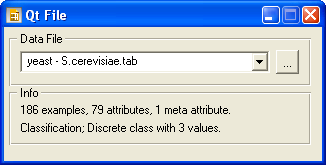
Locate your data by clicking on a "..." button in the top right part of the dialog. This opens the Open File dialog. Select the data set you wish to visualize. You can use our example data files (see metabolic or cell cycle example, or just download the corresponding data set, yeast - S.cerevisiae.tab and cell-cycle - G1- S/G2.tab. Orange accepts data files saved in different file formats. For a description of this formats see Orange Reference. A file format that we often use is tab-delimited. In this case, the header in the file contains three lines. The first line in the file represents the names of the attributes, the second line is the type of each attribute (whether it is continuous or discrete) and the third line defines which attribute is the class attribute. Values for four features and the class for a few examples from Brown et. al. (2000) data set in this format looks like this: Once the data set is loaded, File widget shows the data set file name in the combo box and presents a short information about the data (see the screenshot below). The data is immediately sent to the scatterplot and radviz widgets and projections can be seen by double-clicking on scatterplot or radviz icon in the canvas.
Using VizRankTo learn how to rank projections offered by these two widgets, see VizRank's graphical interface section of this supplement. References: Brown, M.P., Grundy, W.N., Lin, D., Cristianini, N., Sugnet, C., Furey, T.S., Ares, M., Haussler, D. (2000) Knowledge-based analysis of microarray gene expression data by using support vector machines, Proceedings of the National Academy of Sciences, 1 , 262�267. |
||||


